Plow SMI
Production-Grade GPU Observability and Control for Heterogeneous AI Infrastructure
Plow SMI: a unified, vendor-agnostic platform built in Rust that brings first-class GPU telemetry, interactive monitoring, and power/clock control into a single, extensible toolkit.
The Problem
The AI/ML revolution has placed accelerators at the center of modern compute. Organizations operate heterogeneous fleets spanning NVIDIA GPUs, AMD GPUs, Intel GPUs, and Google Cloud TPUs — yet accelerator observability remains one of the largest blind spots in production infrastructure.
The tooling landscape is fragmented. Every vendor ships its own incompatible CLI. There’s no native Prometheus support. No terminal dashboards. No unified observability and control layer. And the community alternatives? Python scripts with high overhead and limited metrics.
For teams running GPU clusters at scale, this means delayed incident response, wasted compute from invisible underutilization, operational toil from manual SSH sessions, and blind capacity planning without historical metrics.
What Is Plow SMI
Plow SMI is a complete accelerator observability and control platform. One toolkit that unifies monitoring, metrics export, and power/clock control across all vendors — shipping as zero-dependency static Rust binaries, with no compile-time GPU SDKs required.
It is also an embeddable library. The core data collection and control logic ships as reusable Rust crates that can be integrated into any application — your custom orchestrator, your training framework, your fleet management daemon. Use it as a standalone tool or embed it directly into your infrastructure.
Three pillars. One platform:
All three ship together in a single unified plow-smi binary, or standalone as plows-top, plows-exporter, and plows-ctl.
The Interactive Terminal Dashboard
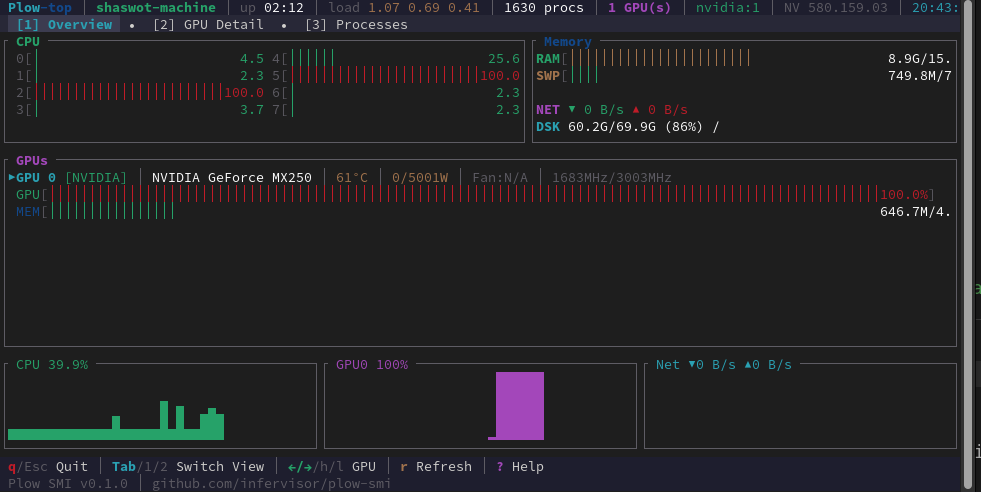
Everything at a glance. Per-core CPU utilization, RAM and swap, network throughput, disk space, GPU utilization with real-time bars, and rolling sparkline history — all in one terminal window.
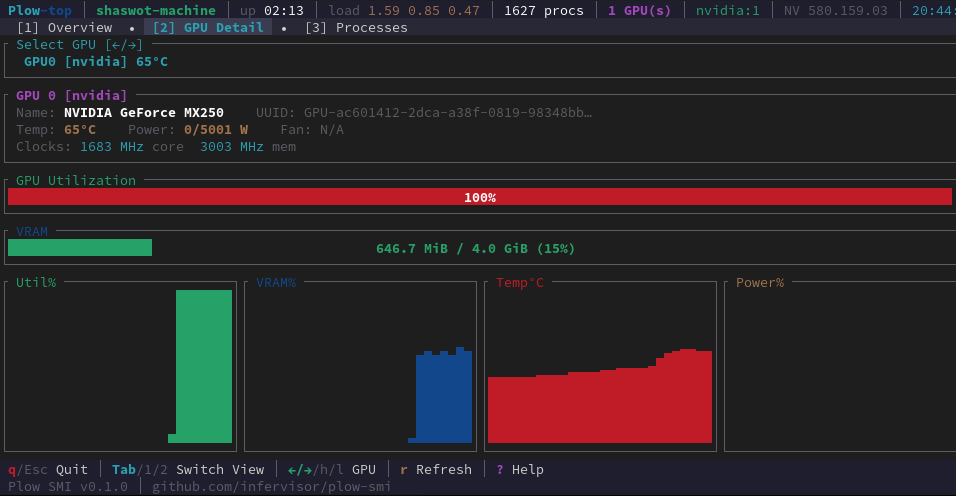
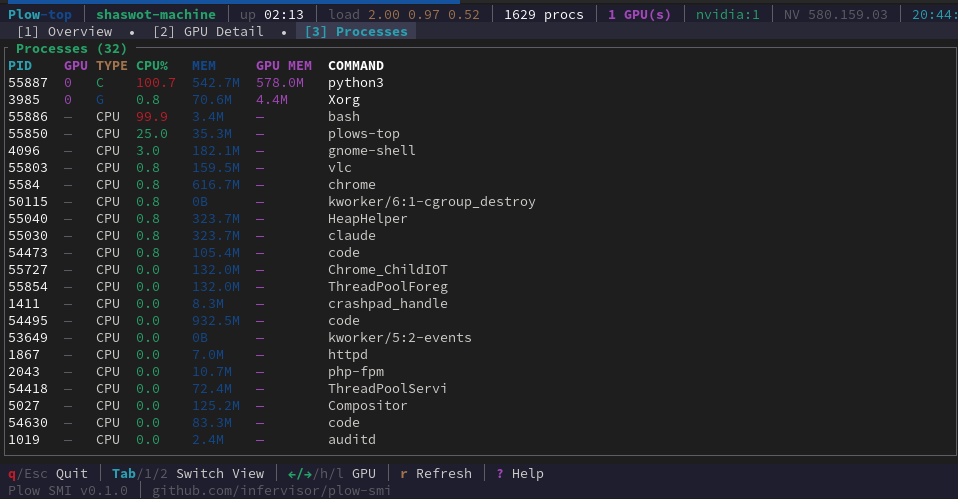
Switch to the GPU Detail or Processes tab to drill into per-device clocks/temps/power or see exactly which processes are consuming your GPU.
The Prometheus Exporter
Plow SMI exposes 25+ GPU and system metrics as a production-grade Prometheus scrape target. Drop it onto any node, and your existing Grafana stack immediately gains full accelerator visibility — utilization, memory, power, thermals, clocks — all with consistent labels across vendors.
The exporter is built around an extensible Collector pattern. Today it supports NVIDIA, AMD, Intel, and Google Cloud TPU — implementing one interface adds new hardware, and every dashboard, alert, and visualization works automatically.
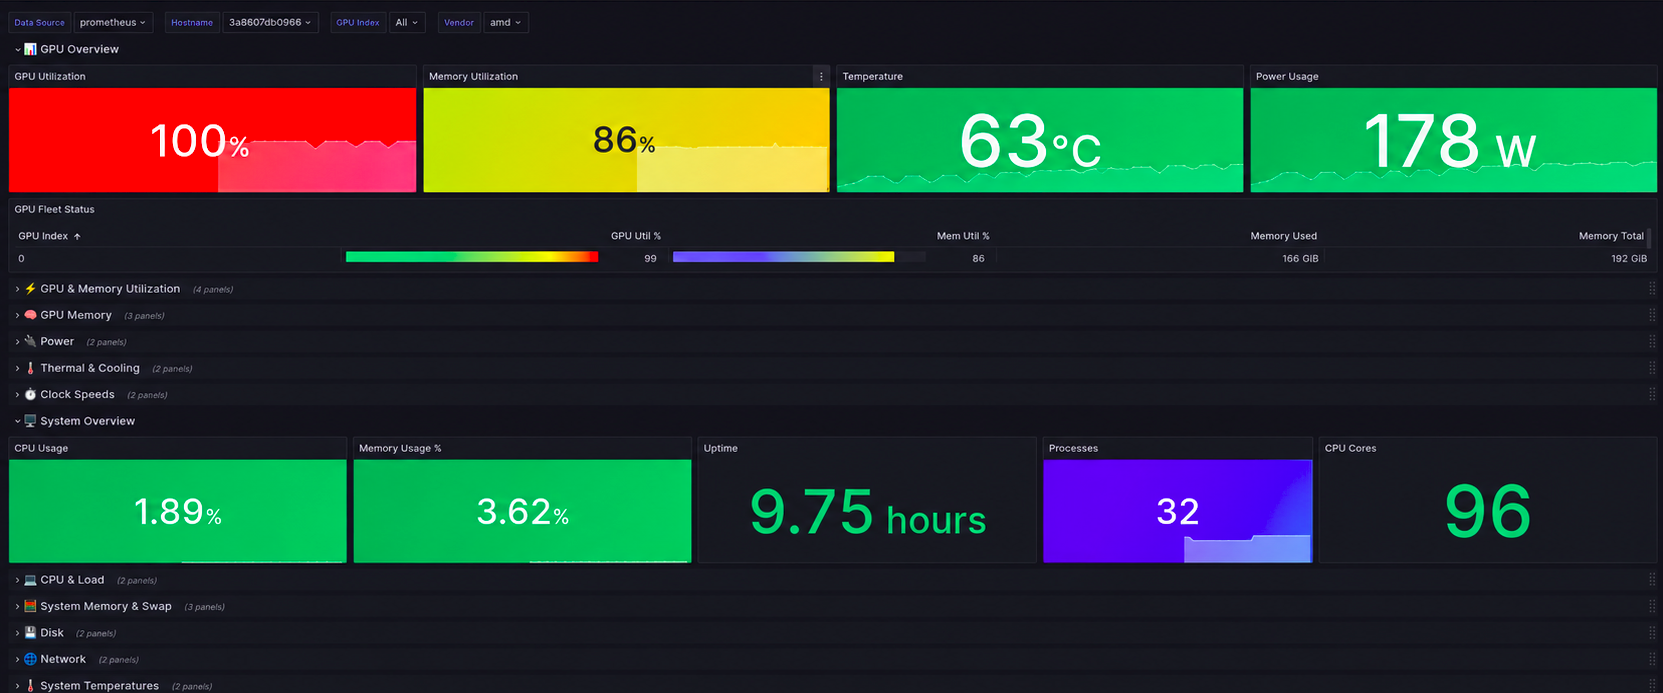
Ships with a pre-built Grafana dashboard. GPU fleet overview, per-device deep dives, system correlation panels, and template variables for filtering by hostname, GPU index, and vendor. Import the JSON and you’re done.
Power & Clock Control
Beyond observability, Plow SMI can act. plows-ctl lists and inspects every GPU across NVIDIA, AMD, and Intel — and for NVIDIA and AMD, sets power limits, application clocks, and performance levels directly:
plow-smi ctl nvidia-list
plow-smi ctl nvidia-set-power-limit 0 --watts 300
plow-smi ctl amd-set-perf 0 --level high
plow-smi ctl nvidia-reset 0
No separate nvidia-smi or rocm-smi invocation required — one CLI, one output format, across vendors. Set operations need root/sudo, matching the vendor tools’ own privilege model.
Embeddable Library
Plow SMI isn’t just a set of binaries — it’s a library-first architecture. The core crates (plows-gpu, plows-exporter, plows-ctl) are designed to be embedded into any Rust application:
- Custom orchestrators — embed GPU metrics collection directly into your job scheduler
- Training frameworks — add real-time GPU telemetry to your ML training loops
- Fleet daemons — integrate GPU telemetry and control into your existing node management agent
- CI/CD pipelines — query GPU state programmatically during build and test
Add it as a dependency, call the collector or control APIs, and you have production-grade GPU telemetry and control without running a separate process.
Why Plow SMI
Unified. One platform replaces nvidia-smi, rocm-smi, separate monitoring daemons, and custom scripts. Same interface regardless of vendor.
No compile-time GPU SDKs. Vendor libraries (libnvidia-ml, libamd_smi, libze_loader) are loaded at runtime via dlopen. One binary works on CPU-only hosts and picks up GPUs automatically when drivers are present — no CUDA, ROCm, or oneAPI toolchain needed to build or ship.
Extensible. Supports NVIDIA, AMD, Intel, and TPU today. Adding new accelerators is implementing one trait. The platform grows with your infrastructure.
Embeddable. Use it as standalone binaries or embed the library directly into your own applications. No IPC, no sidecar containers — just link and call.
Zero-config. Auto-detects available hardware at startup. Gracefully skips unavailable vendors. Works immediately with no configuration files.
Lightweight. Static Rust binaries. No Python, no Node, no containers needed.
Production-ready. Prometheus-native metrics, Kubernetes liveness probes, graceful shutdown, structured logging, and pre-built Grafana dashboards.