The cold-start tax
Why vLLM recompiles itself at every boot — and how plow removes it
vLLM and SGLang cold starts are CPU-bound JIT work, not GPU compute. A phase-by-phase breakdown, measured boots and loaded footprints on GH200 and RTX PRO 6000, and how plow’s static compile path takes that tax off the critical path.
A GPU that burns money and serves nothing
An autoscaler sees a traffic spike and schedules a new replica. The image pulls, the container starts, vllm serve runs — and for the next one to eight minutes that GPU serves nothing. This isn’t a hardware limit or a vLLM bug. It’s what you get when a just-in-time compiler sits on the critical path of every boot.
This post breaks down where vLLM (and SGLang) startup time goes — from published instrumentation and our own runs — then shows how plow moves that compile work off the boot path.
- Boot is CPU-bound — imports, graph tracing, kernel codegen — not GPU compute.
- torch.compile, kernel JIT, and per-shape CUDA graphs each run again on every fresh process.
- SGLang shares the architecture and pays the same tax.
- plow compiles ahead of deploy via
plowc, so replicas boot without that stack.
Why cold start matters
Serverless and autoscaled LLM stacks see peak-to-mean ratios of 2–20× in production traces — autoscalers are constantly booting replicas, not once at deploy (Kabakibo et al., 2026). Every boot lands on time-to-first-token for whoever triggered the scale-up.
Cold-start lifecycle on a scale-up
autoscaler spike → image pull → JIT boot → idle GPU → first token
The expensive middle is the serving engine compiling itself before it can answer.
A ~5-minute cold start costs about $0.30/pod in idle GPU time; 50 pods recycling daily is ~$15/day before any tokens (Microsoft Community Hub). Engine startup — not image pull — was ~56% of cold start for Llama 3.1 8B in that writeup. A 27B serverless run hit 460 s; stripping torch.compile and CUDA graphs only got to 219 s, and gave up the optimizations those features exist for (logeshumapathi.com). You can trade compile time against steady-state throughput; you can’t opt out of one of them.
Anatomy of a vLLM cold start
“Breaking the Ice” instrumented vLLM v0.10.1.1 across 22 models and found startup is predominantly CPU-bound: sequential, largely single-threaded Python. Swapping GPUs moved most phases <5%; swapping the CPU moved several phases a lot (arXiv:2606.07362). Not a “buy a faster GPU” problem.
Six phases — where the work runs
Breaking the Ice decomposition · CPU vs GPU bound · kernel JIT under the compile path
Framework bootstrap and weight loading
Backend detect, imports of PyTorch/Transformers/plugins, and config/tokenizer fetch cost several seconds before any math. Weight load scales linearly with size × precision (0.5–4.7 s for ~1.8B–16B in the paper, warm page cache) but is only 7–10% of total startup — cold SSD vs cache is ~1.04× overall. Once the JIT stack is gone, weight upload is most of what’s left; see roofline.
torch.compile: Dynamo and Inductor
vLLM’s compile path uses TorchDynamo + TorchInductor (docs). One PR on Llama-3-8B: Dynamo 4.6 s + Inductor 14.77 s ≈ 19.4 s before graph capture (PR #11005). Custom bytecode decompilation alone can cost ~7 s on 70B-class models (#20451). Paper ranges: Dynamo 3.1–6.3 s; warm artifact load 2.2–5.7 s; fully cold store 11–21 s. That cache dies on GPU/driver/precision changes — exactly when autoscalers spin new nodes.
JIT stack on the critical path
framework → Dynamo → Inductor → kernel JIT → CUDA graphs · every fresh process
Kernel JIT
FlashInfer / Triton / DeepGEMM JIT kernels for head dim, dtype, and arch on first use. Fragile as well as slow: FlashInfer GDN prefill can deadlock across TP workers (#41865); aarch64 paths that work on x86 can fail outright. vLLM’s own VLLM_USE_AOT_COMPILE exists “to reduce runtime JIT latency” (DeepWiki).
KV profiling and CUDA graph capture
Only the last phases are GPU-bound. Profiling is cheap in isolation (0.7–1.0 s dense in the paper) but triggers compile on first call — and can balloon (≈210 s on an NVFP4 MoE even with a warm torch.compile cache, #44881). CUDA graphs are per batch shape; limiting shapes cut one Llama 3.1 8B deploy 294 s → 82 s (Tensorfuse).
Literature ranges vs one measured boot
| Phase | Typical range |
|---|---|
| Framework bootstrap | Low single-digit seconds |
| Weight loading | 0.5–4.7 s (1.8B–16B) |
| Dynamo tracing | 3.1–6.3 s |
| Inductor / load cache | 2.2–5.7 s cached; 11–21 s cold |
| Kernel JIT | Seconds to tens of minutes |
| KV profiling | 0.7–1.0 s typical; up to ~210 s |
| CUDA graph capture | 0.9–1.8 s+ |
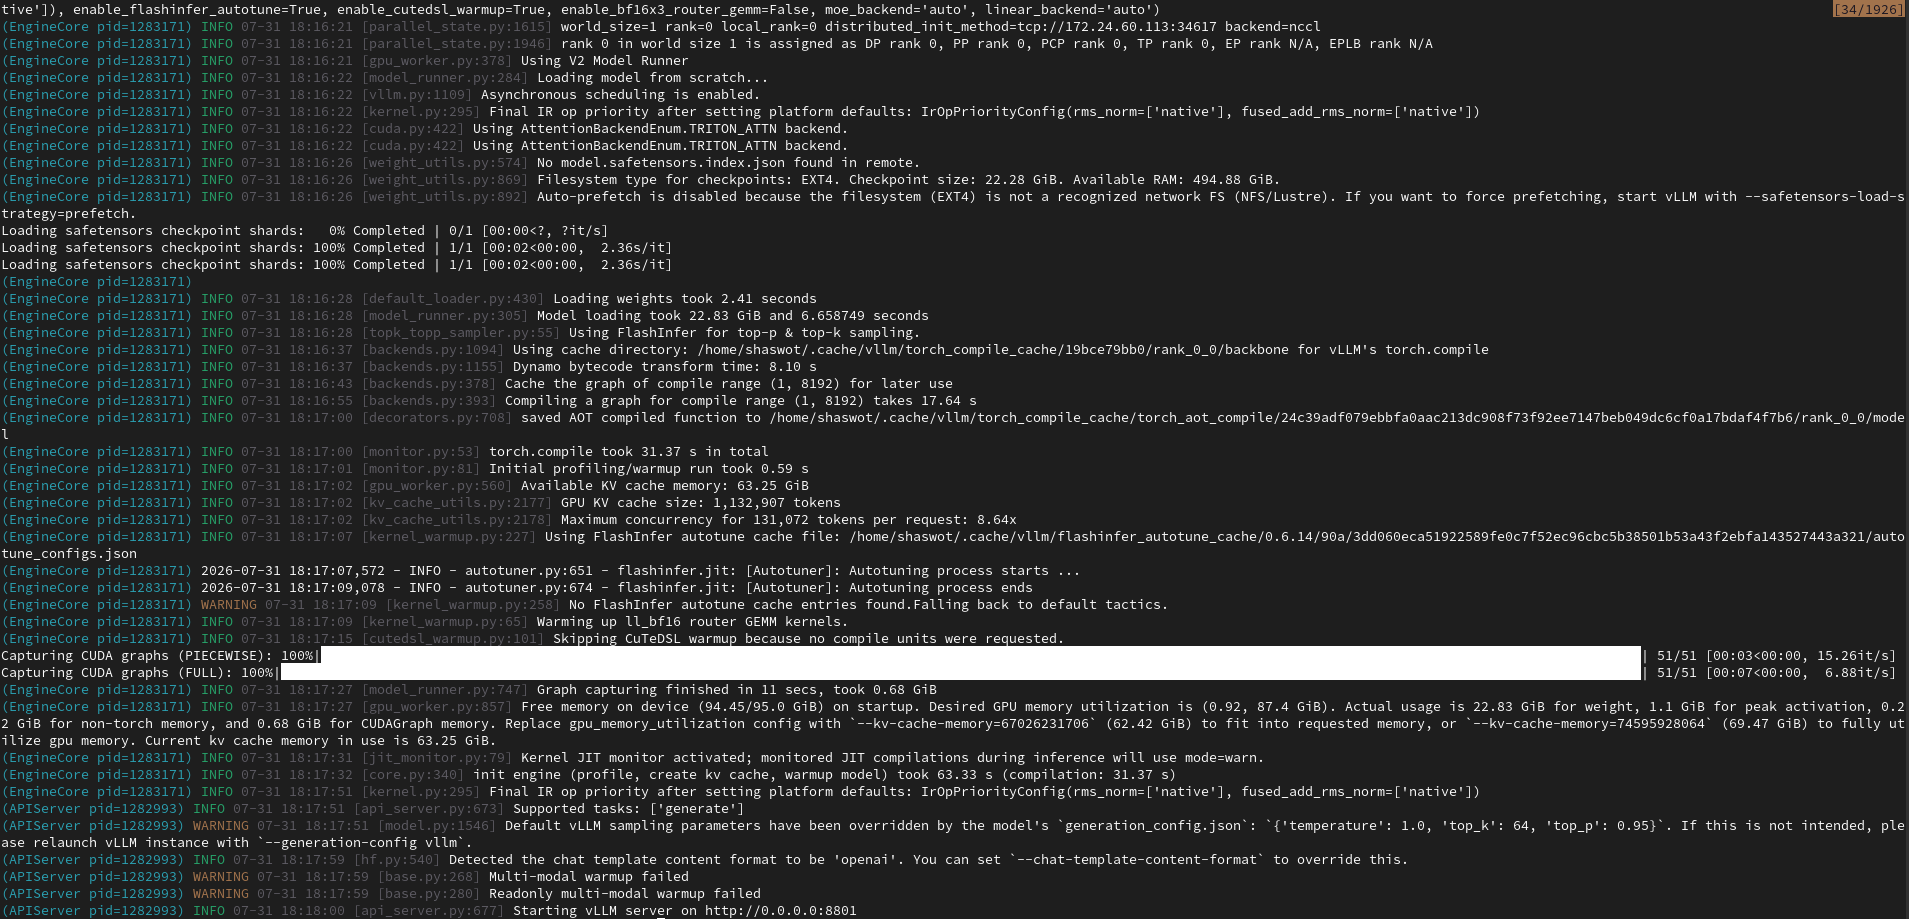
Same tax buckets, concrete wall — vLLM · Gemma 12B · GH200 · context 128k. Model load is 6.69 s of a 122 s boot.
| Phase | Time |
|---|---|
| Bootstrap (API + Engine init + NCCL) | 48 s |
| Model Loading | 6.69 s |
| Dynamo + Inductor | 4.41 s |
| Kernel JIT Warmup | 7 s |
| CUDA Graph Capture | 12 s |
| Engine Profiling / KV Cache / Warmup | 33 s |
| API Warmup | 11 s |
| Total Startup | 122 s (2 min 2 s) |
SGLang pays the same tax
Same architecture, same bottlenecks. DeepGEMM v2 warmup: ~23 min prefill / ~11 min decode, still slow on “warm” relaunches (#9867). Another writeup: 88 s restart with warm page cache and persisted kernel caches — only 31 s loading weights; 57 s imports/config/autotune/warmup (Fergus Finn). Their fix was CRIU + cuda-checkpoint (~12 min → ~10 s) — engineering around the compile pipeline, not removing it. Caching and checkpoint help; they don’t change the root cause.
Compile before deploy
TensorRT-LLM proves AOT removes runtime JIT — and pays that cost at build (≈7+ min for 40B+/70B, often 25–45 min full cycles), tied to SKU and shape envelope. Megakernel AOT work measured Qwen3-32B warmup at 123 s vLLM / 583 s SGLang vs 35 s AOT, with a one-time offline 107 s build replacing 67 per-shape CUDA graphs (arXiv:2604.13327). vLLM itself is adding -O, VLLM_USE_AOT_COMPILE, and sleep mode for the same reason (vLLM Blog) — retrofitting AOT onto a JIT-first design.
What plow changes
plow + plowc start from that AOT foundation. plowc takes graph, precision, and target hardware (e.g. fp8 Gemma-4 12B for RTX PRO 6000 or GH200) and emits a static artifact. At boot there is no Python import chain, Dynamo, Inductor, FlashInfer/Triton JIT, or per-shape CUDA graph capture loop. What’s left: load the runtime image, stream weights, serve.
JIT every boot vs compile once
left: vLLM / SGLang · right: plowc offline, then plow per replica
Tradeoff is real: you commit to GPU arch and shape envelope at build time. Difference vs TensorRT-LLM is when — plowc sits outside the deploy path, not on every scale-up.
Methodology
GH200 vLLM numbers below were collected on one box so others can re-run the same serve line. plowrt wall clocks and footprints on the same GPU use the same model family and context; the runtime path is proprietary and is not reproduced here.
- Machine — Supermicro ARS-111GL-NHR · Ubuntu 22.04.5 LTS · kernel
6.8.0-1059-nvidia-64k· aarch64 · 72× Neoverse-V2 · local NVMe root - GPU — NVIDIA GH200 480GB · compute capa 9.0 · 97 871 MiB reported · driver 580.173.02 · CUDA 13.0 (toolkit 13.0.3)
- Software — Python 3.10.12 · PyTorch 2.11.0+cu130 · vLLM 0.26.0
- Models —
google/gemma-4-12b-itandgoogle/gemma-4-31b-it·--dtype bfloat16· TP=1 ·--max-model-len 131072 - Metric — wall clock from process start to first successful
GET /v1/models(time to API ready) - Memory — vLLM’s own startup line: “Actual usage is … for weight, … for peak activation, … for non-torch memory, and … for CUDAGraph memory” (excludes KV cache)
Replicate the 31B boot (swap the model id for 12B). Cold-start timing runs omit --enforce-eager:
vllm serve google/gemma-4-31b-it \
  --attention-backend TRITON_ATTN \
  --dtype bfloat16 \
  --tensor-parallel-size 1 \
  --max-model-len 131072 \
  --scheduling-policy fcfs \
  --port 8000
Add --enforce-eager only when comparing the eager memory column. On this stack (vLLM 0.26 · TRITON_ATTN · 128k), the 31B default boot already reported 0.0 GiB CUDAGraph memory — same as eager — so graph capture is not a reliable free lunch to toggle off here.
RTX PRO 6000 (RunPod) rows use the same model ids, context, and plowrt vs vLLM pairing; that SKU’s driver/CUDA inventory is not re-listed in this post.
Measured cold starts
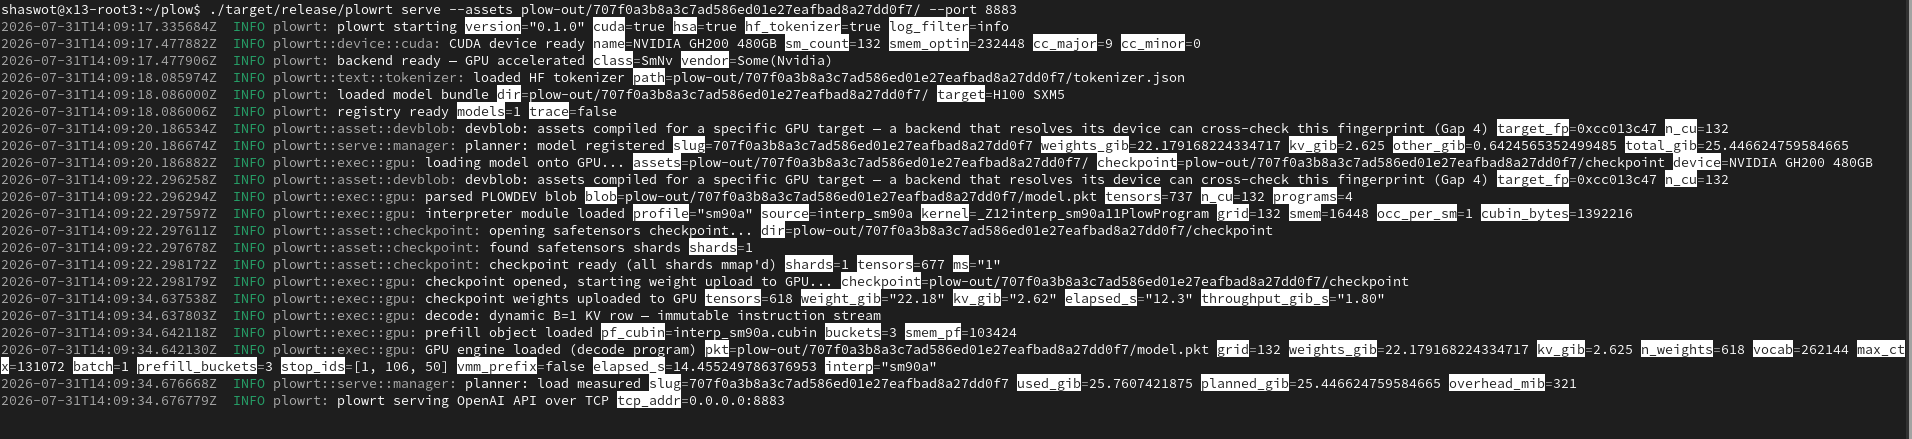
Gemma 12B / 31B, context 128k, one GPU — plowrt vs vLLM on GH200 and RTX PRO 6000 (RunPod). Values are time to API ready / ready to serve. On every plowrt run, Dynamo, compiled-graph load, KV profiling, and CUDA graph capture are 0.00. See methodology for the GH200 vLLM serve line.
Time to API ready — plowrt vs vLLM
seconds · lower is better · Gemma 12B / 31B · context 128k
plowrt: 11 / 17 / 8.55 / 10.93 s · vLLM: 122 / 146 / 98 / ≈140 s
Logs — GH200 · Gemma 12B
left: vLLM · right: plowrt
The memory footprint
Beyond boot time, a loaded vLLM process carries weight storage plus runtime residue — peak activation workspace and non-Torch allocations, and sometimes a CUDA graph pool. plow’s loaded footprint is the static artifact itself. On GH200 with vLLM 0.26 · TRITON_ATTN · 128k, the 31B default boot already reported 0.0 GiB CUDAGraph (same as --enforce-eager); the remaining gap vs plow is weight layout plus activation / non-Torch overhead, not a graph toggle.
| Component | Gemma 12B | Gemma 31B |
|---|---|---|
| Model weights | 22.83 GiB | 58.99 GiB |
| Peak activations | 1.10 GiB | 1.34 GiB |
| Non-Torch memory | 0.22 GiB | 0.22 GiB |
| CUDA graph memory | 0.68 GiB (0.00 eager) | 0.00 GiB |
| Total | 24.83 GiB (24.15 eager) | 60.55 GiB |
Head to head against plow’s loaded footprint on the same machine:
| Model | vLLM | plow | Δ |
|---|---|---|---|
| Gemma 12B | 24.83 GiB (24.15 eager) | 22.18 GiB | −2.65 GiB (~11%) |
| Gemma 31B | 60.55 GiB | 57.18 GiB | −3.37 GiB (~6%) |
Readout
- plow’s footprint is smaller on both sizes — 22.18 vs 24.83 GiB on 12B and 57.18 vs 60.55 GiB on 31B — without asking the reader to toggle eager mode.
- plow is smaller than vLLM’s weights alone (22.18 vs 22.83 GiB on 12B; 57.18 vs 58.99 GiB on 31B): the
plowcartifact packs tighter than the runtime-deserialized layout. - On 31B with this attention backend and context, CUDA graph memory is already 0 in the default boot; the leftover vLLM tax is peak activations + non-Torch (~1.56 GiB) plus the weight-layout gap.
Roofline: is weight loading bandwidth-bound?
With compile off the path, residual cold start is mostly weight upload. If wall throughput approaches hardware ceilings, the phase is bandwidth-bound; if not, storage and software dominate.
Same machine and models; not identical timers. vLLM: Nsight transfer counters + vLLM load timing. plowrt: its own load breakdown (upload_all, Disk→RAM, RAM→Pinned, DMA overlay, GpuEngine::load()). Wall clocks are comparable; microphases are not the same counters.
Throughput (GiB/s) = Model Size (GiB) / Loading Time (s)
Effective weight-loading throughput
GiB/s · higher is better · size ÷ wall load time
plowrt: 3.40 / 3.43 / 6.90 / 10.24 GiB/s · vLLM: 3.41 / 2.53 / 5.11 / 6.70 GiB/s · near NVMe, far below PCIe Gen5 / C2C
Path: Disk → Host memcpy → H2D/DMA → HBM. Peak ceilings: NVMe Gen4 5–7 GiB/s · Gen5 ~14 · PCIe Gen5 ×16 ~64 · NVLink-C2C 450 · HBM 1.8–4 TiB/s. H2D moved 22.31 / 58.46 GiB (12B / 31B); D2D rearrange was 48.37 / 68.38 GiB; plow DMA payload was 22.55 GiB on 12B.
| Stage | Time | Bandwidth |
|---|---|---|
| vLLM total model load | 6.69 s | 3.41 GiB/s |
| vLLM H2D (Nsight) | 0.153 s | 146.1 GiB/s |
| vLLM D2D (Nsight) | 0.030 s | 1626 GiB/s |
| plowrt GpuEngine::load() | 6.64 s | 3.40 GiB/s |
| plowrt Disk→RAM (overlay) | — | 4.87 GiB/s |
| plowrt RAM→Pinned | 26.5 ms | 851 GiB/s |
| plowrt Pinned→GPU DMA (overlay) | 2.47 s | 9.13 GiB/s |
| plowrt blob parse | ~2.06 s | — |
| Stage | Time | Bandwidth |
|---|---|---|
| vLLM total model load | 23.32 s | 2.53 GiB/s |
| vLLM H2D (Nsight) | 0.311 s | 187.9 GiB/s |
| vLLM D2D (Nsight) | 0.042 s | 1647 GiB/s |
| plowrt GpuEngine::load() | 16.75 s | 3.43 GiB/s |
| plowrt Disk→RAM (overlay) | — | 3.90 GiB/s |
| plowrt RAM→Pinned | 7.40 s | 7.78 GiB/s |
| plowrt Pinned→GPU DMA (overlay) | 199 ms | 289 GiB/s |
| plowrt cuMemAlloc | 5.20 s | — |
| plowrt blob parse | ~2.06 s | — |
Readout
- Wall load sits at ~2.5–10 GiB/s — near NVMe, 45–180× below GH200’s 450 GiB/s C2C. Interconnect is not the roof.
- vLLM H2D is still fast (146–188 GiB/s) and only 0.15 / 0.31 s of a 6.69 / 23.32 s load. plow DMA is 9.13 GiB/s on 12B (~2.47 s overlay) vs 289 GiB/s on 31B; wall for 12B is Disk→RAM (~4.55 s @ 4.87 GiB/s), DMA overlay, and blob parse (~2.06 s). RAM→Pinned is trivial (26.5 ms).
- On GH200 weight load alone, plow is not uniformly faster (6.64 vs 6.69 s on 12B — nearly tied; 16.75 vs 23.32 s on 31B). The cold-start win is removing JIT/compile, not winning the transfer roof.
Verdict: weight loading is storage- and software-bound, not interconnect-bound. Don’t equate Nsight H2D / plow DMA peaks with effective wall GiB/s.
Limitations
- Asymmetric tooling — Nsight + vLLM logs vs plowrt logger; walls comparable, subphases not.
- Scope — single GPU, Gemma-4 12B/31B; page-cache vs cold SSD not separately controlled on GH200.
- Overlays — plow Disk→RAM / DMA bands don’t sum to wall.
- vLLM “total model loading” includes deserialize + D2D rearrange beyond H2D.
- RTX PRO 6000 rows lack the Nsight / plow-logger microphase dig and the full methodology inventory listed for GH200.
- Memory footprint — plow figures come from plowrt load-stage logs (bytes resident after load); vLLM figures from the “Actual usage is …” profiler line. 31B was re-checked on vLLM 0.26.0 (CUDAGraph already 0 without
--enforce-eager); 12B CUDA-graph delta still reflects an earlier profiler dump on the same SKU.
Bottom line
Cold start in vLLM/SGLang is structural: compile the graph inside the serving process on every boot. It’s CPU-bound, shows up across engines, and maintainers are already adding AOT flags. plow moves compile to once-offline. After that, residual GH200 cost is weight load — storage- and software-bound, not NVLink-C2C. That makes scale-to-zero and model swaps routine instead of multi-minute events: plowrt 11 / 17 s on GH200 and 8.55–10.93 s on RTX PRO 6000 vs vLLM in the 98–146 s range on the same configs.
plow also serves the same model on less GPU memory than vLLM. Loaded and ready to serve, excluding KV cache: 22.18 vs 24.83 GiB on Gemma 12B (−2.65 GiB, ~11%) and 57.18 vs 60.55 GiB on 31B (−3.37 GiB, ~6%). On both sizes the plow artifact is smaller than vLLM’s weights alone, and that difference is headroom the KV cache gets back on the same card — see the footprint breakdown.
Further reading
- Kabakibo, Trivedi & Wang, “Breaking the Ice: Analyzing Cold Start Latency in vLLM,” MLSys 2026
- “Event Tensor: A Unified Abstraction for Compiling Dynamic Megakernels”, arXiv:2604.13327
- vLLM Blog, torch.compile with vLLM
- vLLM Docs, torch.compile design
- vLLM: #20451, #11005, #44881, #41865
- SGLang #9867 · Fergus Finn on SGLang starts
- Microsoft: container cold-start dissection · Tensorfuse on vLLM cold start